

When interactive whiteboards first appeared in the training industry, they were a game-changer, quickly displacing chalk and duster as the major teaching and learning medium. One of the key factors that make e-learning courses interesting and successful in grabbing the learner’s attention is the usage of visuals.
Research shows that when text was associated with one or more relevant images, readers recalled 65% of the content for a few days after reading it, compared to only 10% when the material was merely a mass of text.
When utilized effectively, visuals offer high-quality training. Moreover, the course’s aesthetic value is improved, making a positive impact on the trainee and relieving them of the strain of reading large quantities of text, navigating linguistic difficulties, and understanding jargons and complex sentence patterns.
Let’s now take a look at some of the visual content that can be used to improve e-learning modules.
1. Multimedia
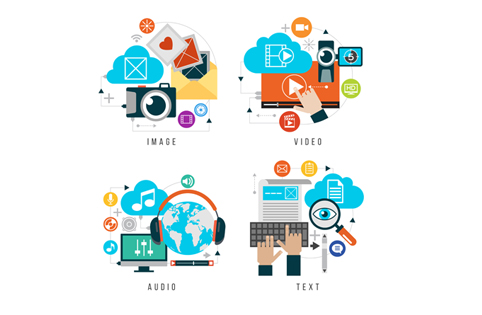
Multimedia has become an integral part of our everyday lives in this technological era, and including it in e-learning modules is essential. The trick is to employ appropriate multimedia in an appropriate context. Here are some of the commonly used multimedia seen in e-learning modules:
1. Images: Images and photographs that are related to your topic not only make the explanation simpler to grasp and clarify complicated terminology, but they also linger in the memory of the learner for a long time. However, they must not be used excessively. Use high resolution and beautiful photos, use images to break down a complicated procedure, and aim to use images that strike an emotional connection with your learners to make effective usage of images.
2. Animated GIFS: GIFs have become one of the most popular methods of sending messages, prompting social media platforms to add support for them. You may use them in several ways in your e-learning modules. Instead of utilizing videos, those require more data to illustrate simple operations.
3. Illustrations: Images may not always be perfect for our requirements. In such instances, Illustration may aid in the representation of complicated connections and hidden patterns, as well as the collection and analysis of data into a processable and understandable format.
4. Videos: When used correctly, videos not only bring your training sessions to life but also enable you to offer your course interestingly by including real-world experiences and scenarios. Case studies and instructional videos are two examples of videos in e-learning courses.

2. Characters and Avatars
Using characters in your e-learning courses makes them more engaging than just scrolling through a block of text. It also offers a familiar setting for your trainees to receive instructions from a teacher or mentor, similar to what they experienced in face-to-face interaction It even assists your trainees to retain the material visually by associating it with your avatar.
When a learner clicks start, for example, they are prompted to provide their name and designation. This helps in understanding your trainees’ demographics and the tone of language which is important to create personalized lessons and memorable characters with whom your learners can connect to.

3. Infographics
Infographics are useful in compressing information and presenting them attractively and engagingly. The essential points will be easier to remember if the material is summarized in a simple infographic. Some of the infographics used in e-learning modules are:
List Infographics- The objective of the list infographic is to make a list more visually appealing than a standard list. It focuses on material that must be presented in a specific order, such as a step-by-step guide to achieving a specific end objective.
Comparison Infographics- A comparison infographic is a visual representation of the key differences between two or more items, services, events, or time periods.
Information Infographics- An informational infographic consists primarily of text and lists, with little reliance on graphics. To aid in the visualization of information, the information is usually improved with appealing color schemes and icons.
Statistical Infographics – An infographic that conveys the story behind your statistics is known as a statistical infographic. Charts, icons, pictures, and attractive fonts are included in the design.
Hierarchical Infographics – Information is organized into pre-defined layers in hierarchical infographics. This style of infographic is used to demonstrate how data is arranged into multiple levels and how those levels are linked. These are typically represented as pyramid charts or flowcharts.
Process Infographics- Process Infographics are used to illustrate, summarize, and simplify procedures. They’re ideal for visualizing marketing plans, on boarding new employees, customer journey maps, product manuals, and recipes, among other things.

4. Visual checklist
A checklist is necessary to visualize key points, objectives of the lessons, summary, references and resources. Visuals such as icons, checkmark icons, or symbols can be used to illustrate each point in the list to make checklists more interesting. Another way to make your course content more interesting is to use an interactive checklist where the learner can check on each accomplished point on the list. Use various color palettes to grab the learners’ attention as well!
Summary
The goal is to express your thoughts with the correct visual material. Experiment with different visuals to discover ones which create engagement and interaction within your learners. We all want to have a productive time, and your corporate adult learner, who is tired of boring presentations and mounds of data, is no exception.


